Fat2
Mus musculus FAT atypical cadherin 2 (Fat2)
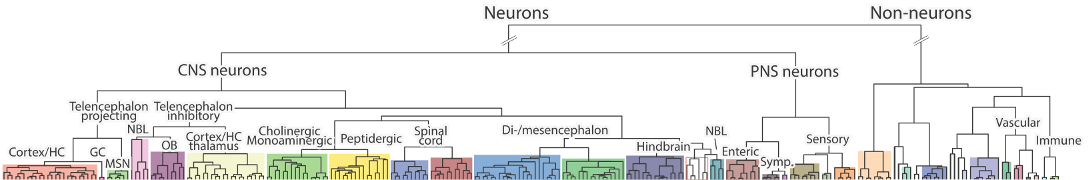

Clusters expressing Fat2
Table shows clusters that express the gene at a trinarization score >= 0.95
| Expression | Index | Symbol | Description | Region |
| 1.1692 | 164 | HBGLU5 | Excitatory neurons, hindbrain | Rhombencephalon |
| 0.52 | 166 | HBGLU7 | Excitatory neurons, hindbrain | Rhombencephalon |
Fat2 is a marker of the following clusters
| Expression | Index | Symbol | Description | Region |
| 1.1692 | 164 | HBGLU5 | Excitatory neurons, hindbrain | Rhombencephalon |